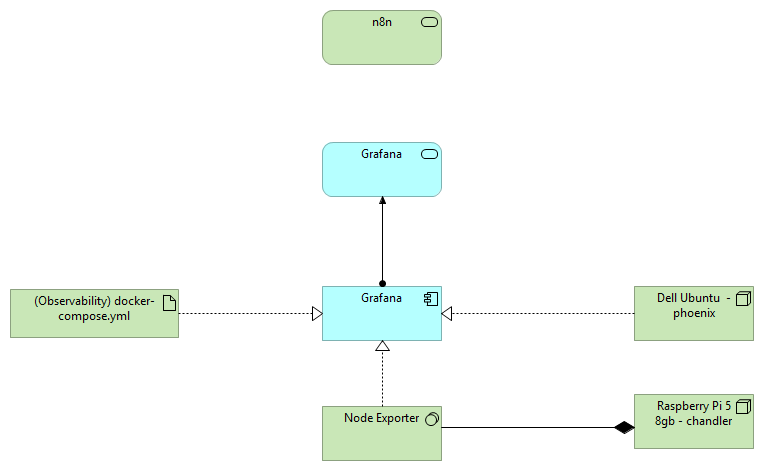
This architecture illustrates a centralized observability framework for your Pi-lab and Dell server ecosystem.
• Grafana acts as the analytics and visualization layer.
• Node Exporter provides consistent metrics from each compute device.
• docker-compose provides declarative deployment for Grafana.
• Raspberry Pi nodes and the Dell Ubuntu server function as monitored compute assets.
• Dashboards provide operational visibility and analytics.
The architecture supports:
• Capacity monitoring
• Performance debugging
• Hardware health supervision
• Future integration with Prometheus, Alertmanager, Loki, Tempo, etc.